The Built Environment
& Healthcare Practitioners
Pilot One: West Side of Charleston
& Healthcare Practitioners
Pilot One: West Side of Charleston
BACKGROUND
Socio demographic inequities exist between the West Side neighborhood and the city of Charleston. The term “inequities” in the case of this work means that the observable group differences evaluated would not exist but for intentional policy decisions that have been made over time. This idea is derived from the notion that inequities are preventable and unjust differences in socioeconomic status between different population groups based on social status. This understanding of inequities is from Margaret Whitehead (1991) “Concepts and principles for tackling social inequities in health.”
In general, West Side indicators of demographic, economic, health, housing, and neighborhood characteristics significantly lag behind those of Charleston and the state of West Virginia.
The sociodemographic analysis presented here was part of a community-based participatory research process and a photovoice exhibition titled, “Imagining the West Side: Constructing Health through the Built Environment”. The exhibition, presented in three locations, was first featured in 2017 at the West Virginia University Health Sciences Center April 10-27, with a tour and panel discussion on April 19th.
Incorporating participatory photoanalytics , GIS mapping, and video with an aim of integrating the voices of vulnerable groups into public policy decision-making, the exhibit shed light on the built environment and population health status of Charleston, West Virginia’s West Side, with photos and narratives supplied by community members and WVU School of Medicine students.
The project paired medical students and community members then put cameras in their hands as they toured the neighborhood, shared stories, took photos and wrote about the significance of these experiences.
DEMOGRAPHIC HOUSEHOLD, NEIGHBORHOOD, TRANSPORTATION, EDUCATION AND INCOME DATA
Matt Purtill July 2016
INTRODUCTION
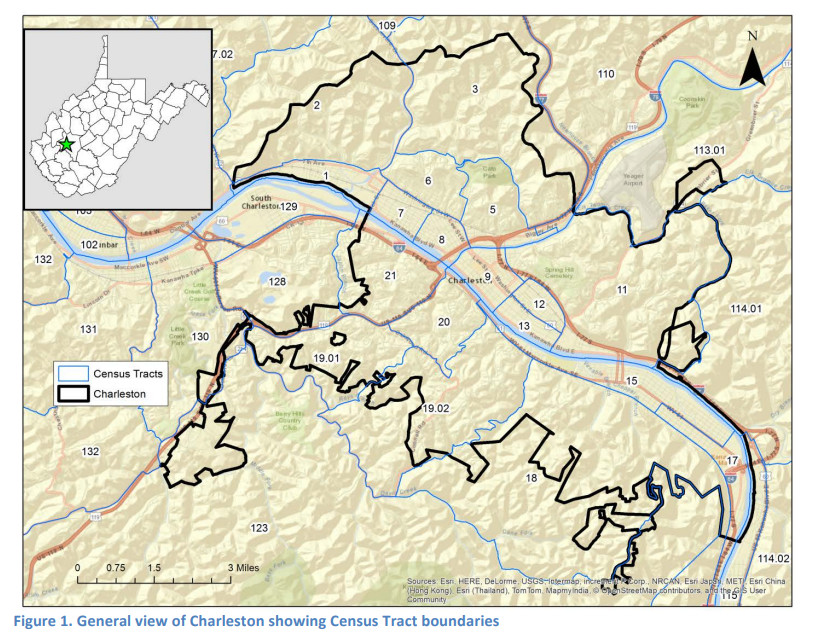
The West Side of Charleston, or simply the West Side, consists of approximately 15 square miles of land north of the Kanawha River and west of the Elk River. This includes portions of Census Tracts 1, 2, 3, 5, 6, 7, and 8 (Figure 1). Based on U.S. Census Bureau’s 2014 American Community Survey 5-year Estimates, Tracts 1, 2, 3, 5, 6, 7, and 8 includes 16,549 residents, or approximately 33 percent of the total population for the city of Charleston.
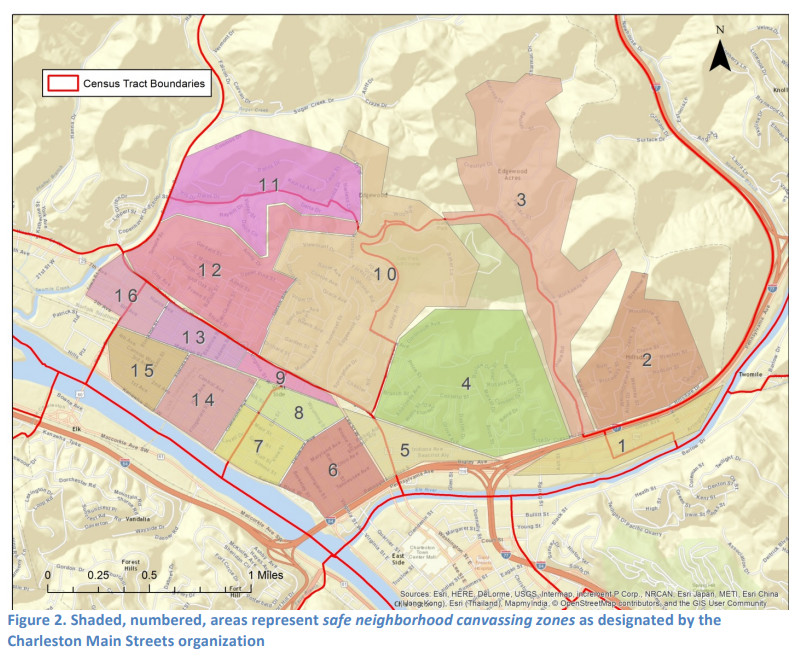
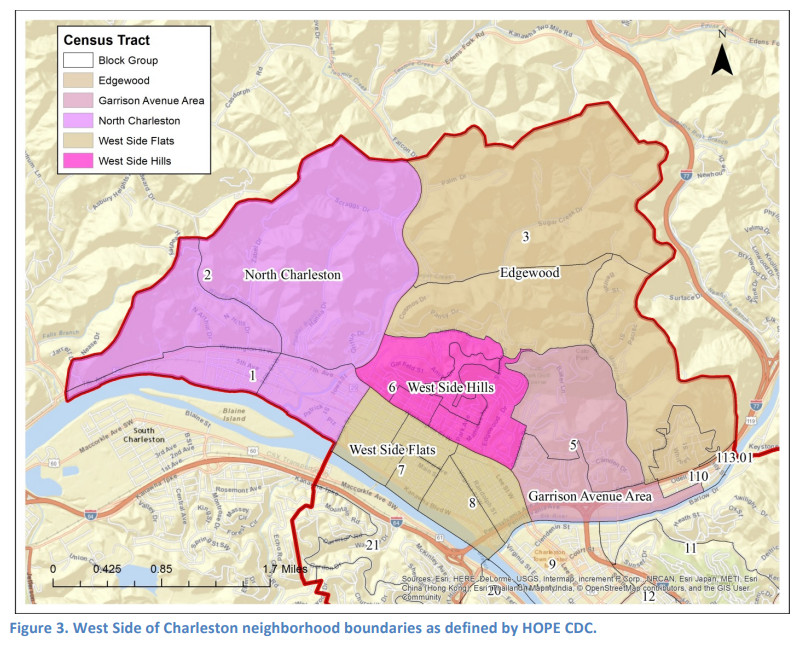
Among Charleston residents, this area can be further subdivided into various neighborhoods or communities, the exact boundaries of which are contested among residents, city officials, and revitalization organizations. For example, as part of their Neighborhood Branding Initiative, Charleston’s West Side Main Streets organization recognizes 16 distinct Safe Neighborhood Canvassing Zones some of which align with traditional historic West Side neighborhoods (Figure 2). In contrast, Pastor Matthew Watts of HOPE CDC discusses the West Side more broadly and suggests that it roughly consists of five neighborhoods: North Charleston (Census Tracts 1 and 2), Edgewood (Census Tract 2), West Side Hills (Census Tract 6), Garrison Avenue Area (Census Tract 5), and the West Side Flats (Census Tracts 7 and 8) (Figure 3).
Read paper here